

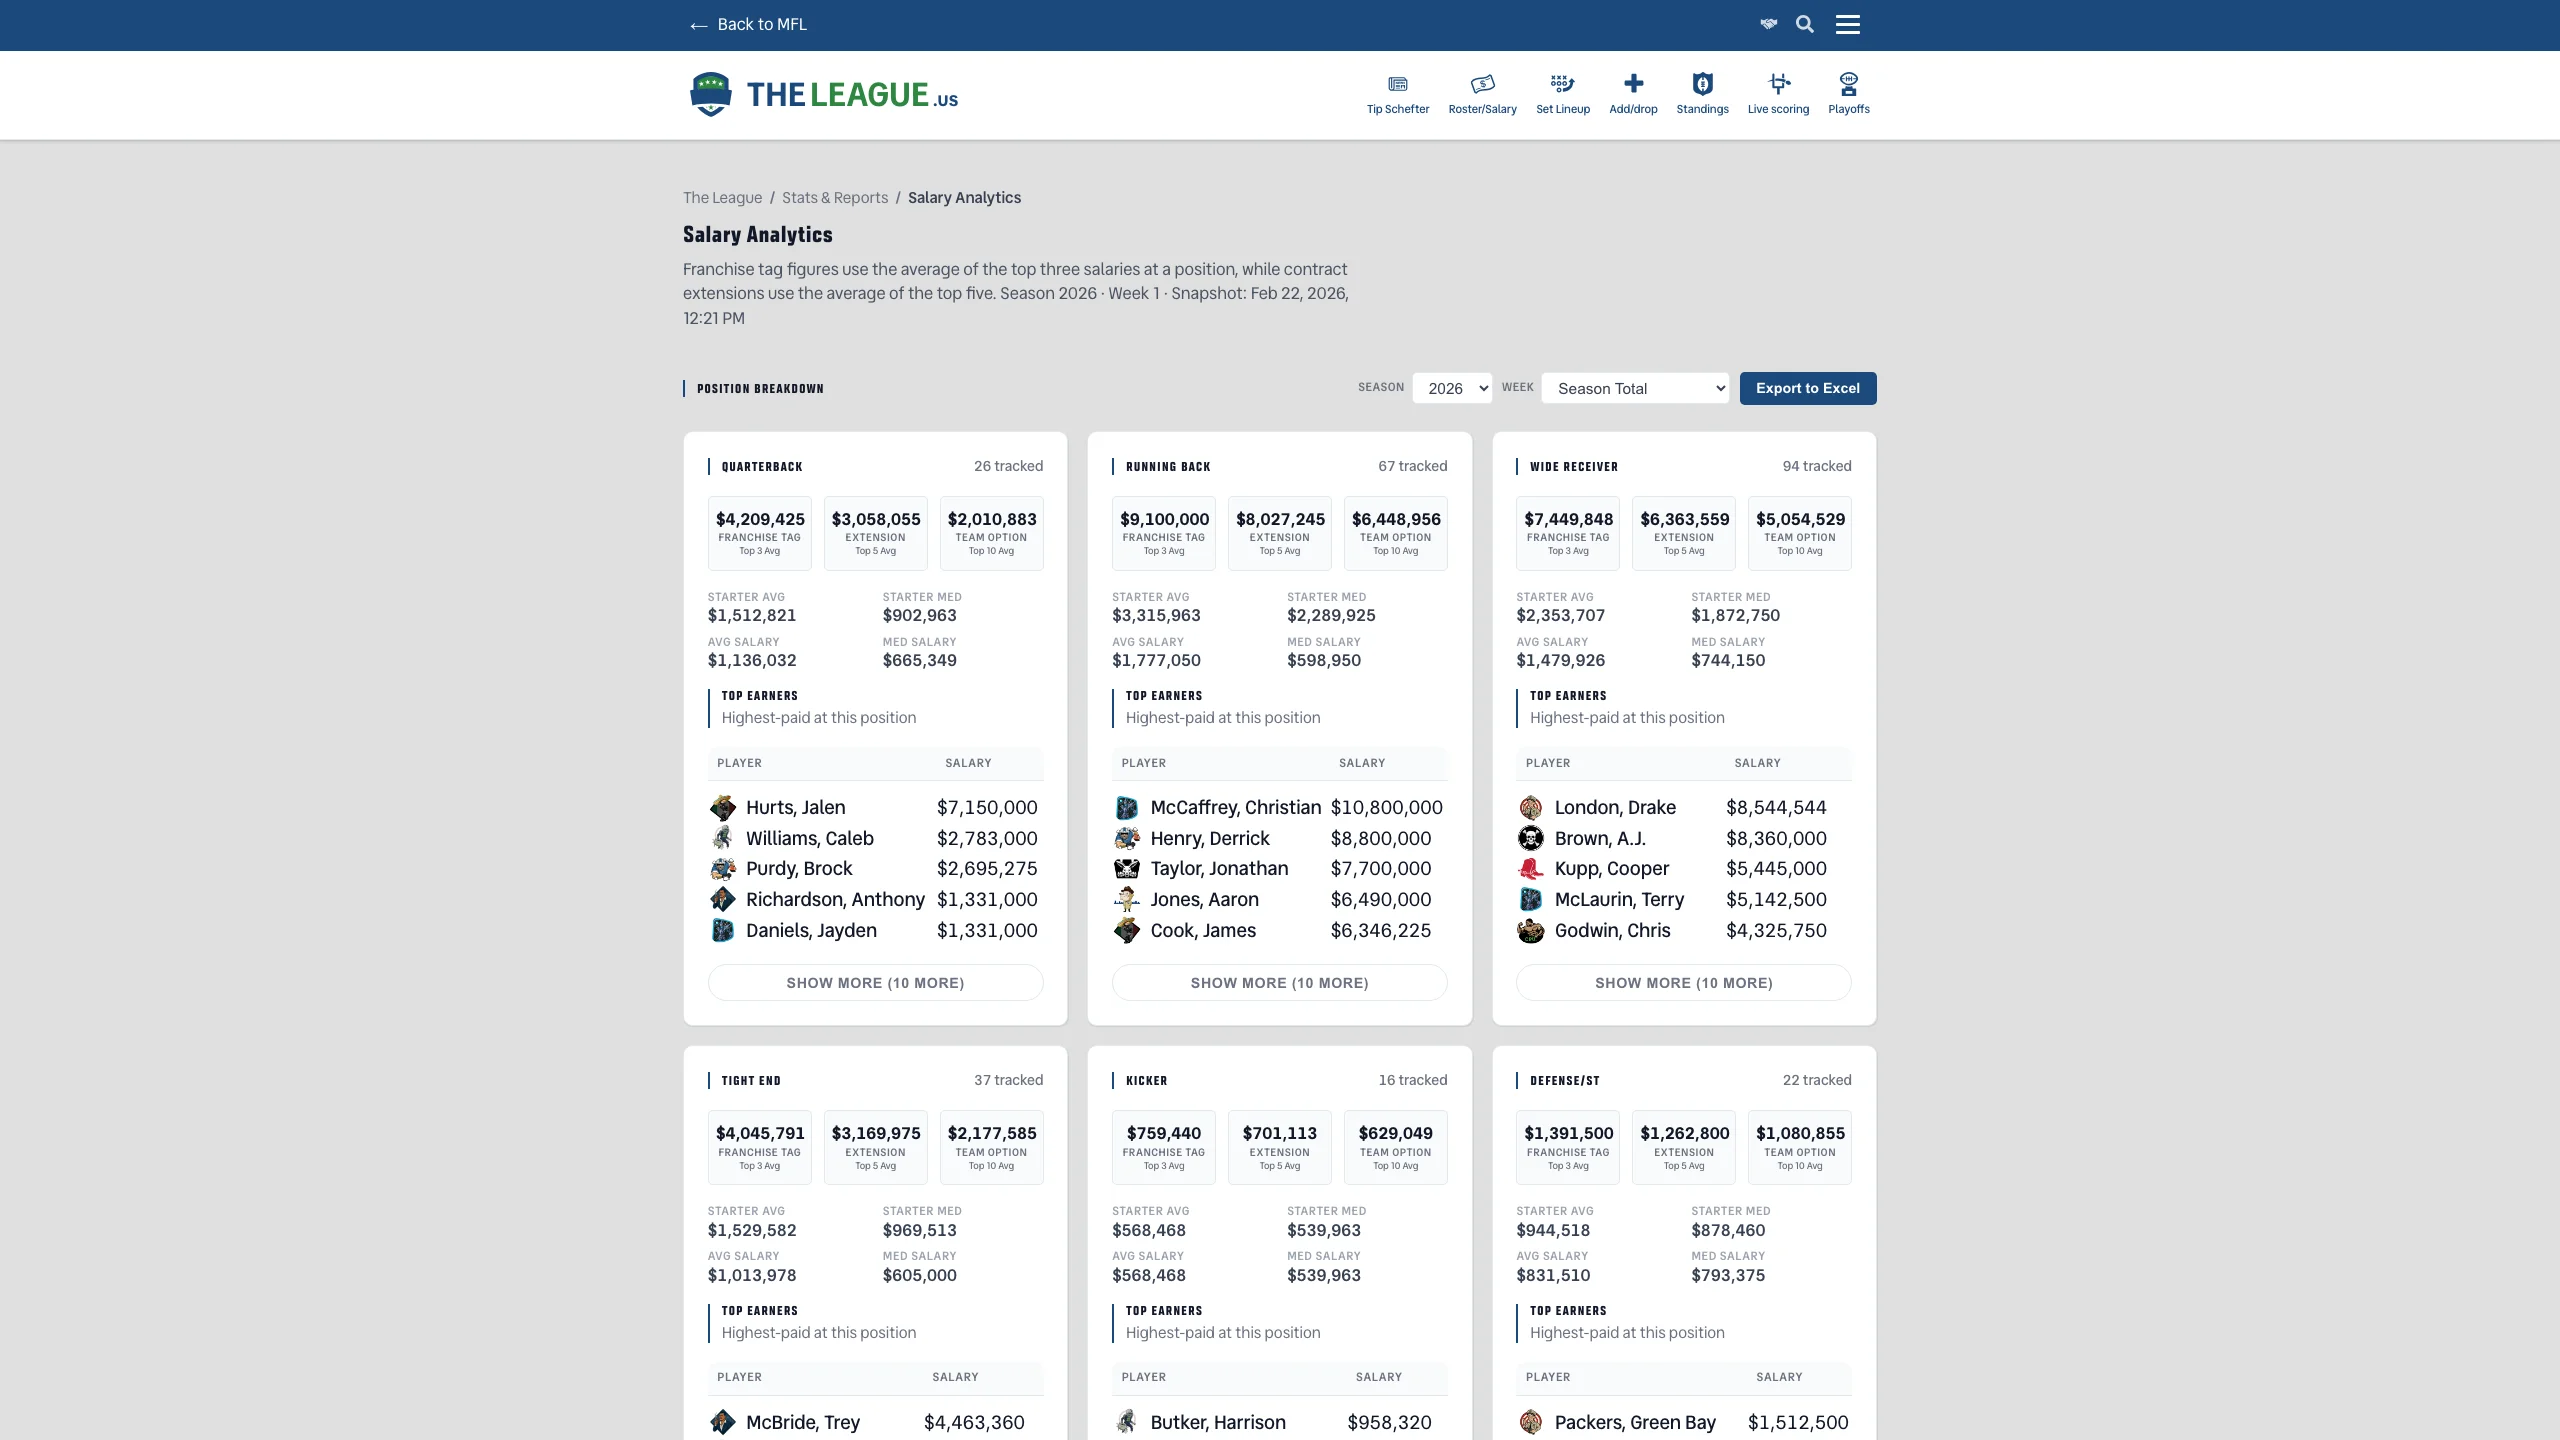
Salary Analytics
Compare your team's spending against league averages by position.
The Full Story
Understanding what your team spends by position is useful. Understanding what your team spends by position compared to what everyone else spends is a competitive advantage. The Salary Benchmarks page provides position-by-position spending comparisons against league-wide averages, making it immediately clear where you're overpaying and where you've found value.
Each position group shows where your spending falls relative to the league average, turning abstract salary numbers into actionable intelligence. If you're 40% above the league average at quarterback and 30% below at running back, that tells a story about your roster construction — and possibly about your upcoming auction strategy.
This was the first salary analysis tool built for the league, and it has since grown into the full Salary Analytics suite. But the core question it answers hasn't changed: are you getting your money's worth?
Message